
![]()
![]()
![]()
![]()
![]()
![]()
![]()
![]()
![]()
|
|
|
Folks, we appreciate your interest in the Radiation Network, and thank you for your support. You may send us an email, but we will not be able to respond to most. Instead, this Message page will address issues that you raise. So please read this page and the archived Messages in lieu of, or before emailing us. We update it occasionally, and it will answer a lot of your questions. Email: admin@radiationnetwork.com Click here for our Mission Statement
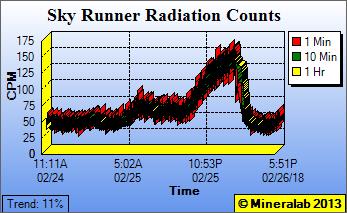
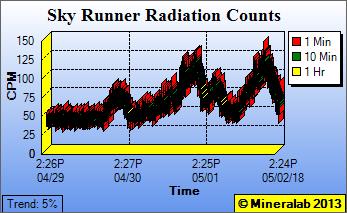
Update: 05/6/18 - Smoky Mountain Alerts Over the last couple of months, a Monitoring Station in Asheville, NC has been intermittently alerting at over 100 CPM. Listed below are graphs from late February and this month.
For context, the operator runs a PRM-9000 model built around an ultra-sensitive pancake style Geiger-Mueller tube. It is located in an upstairs room of his house. When this wave action first began in February, he corroborated the elevated readings by getting a second Geiger counter of the exact same model, so we think the detector is not defective. The graph pattern of the undulating wave crossing back and forth across the 100 CPM Alert level is reminiscent of a Radon event as we've often seen with other stations. So I instructed the station operator to assure that the monitoring room was well ventilated. I am also asking the operator to conduct an experiment where the end window is temporarily sealed so that alpha detection (associated with Radon decay) is halted for the moment. Beyond that, the operator is exploring another theory that a local landfill (Buncombe) is emitting radioactive contamination of a sort, as he conducted a radiation survey onsite, and recorded readings peaking in the 150 to 200 CPM range, against normal background of around 40 CPM. The question is if the elevated readings are coming from the dumping of radioactive fly ash? (a byproduct of coal-fired power plants) at that landfill. Another theory suggests that the elevated detection is sourced from Oak Ridge National Laboratories, located across the Smoky Mountains in Tennessee, about 80 miles to the west northwest. For instance, this re-posted link describes their recent preparation and transfer of nuclear waste: Not to be excluded, there are two nuclear plants operating to the west, along the Tennessee River in southeastern TN, although one might expect a radioactive release to be picked up by other Monitoring Stations in the region, beyond the Asheville station.
Update: 01/18/18 - Best Logistics for Radiation Monitoring
Answer: While indoor monitoring is still relevant, and easily capable of detecting a Fukushima-like incident from many miles away, yes, I agree, outdoor monitoring is optimal, all other things being equal, because the sensor can also "sniff" the air, thus picking up also Alpha and Beta radiation, in addition to Gamma.
Answer: Sounds good. Outdoor monitoring can work, providing you shield the
instrument from precipitation overhead, as well as from wind-blown rain and snow from
the side. The best orientation is to aim any exposed, end or side window of the
Geiger-Mueller tube downward, so that nasty air, etc. has no chance of
accumulating on the window of the GM tube, and yet air currents can still pass
underneath the tube and be sniffed. Likewise, avoid getting the instrument wet,
or aiming any mica end window of the GM tube directly at the sun.
Answer: Sure, lots. Avoid placing the Geiger counter inside a plastic bag, or
otherwise creating an artificial environment for it, which scenario can allow
the potential build-up of Radon decaying by-products. A macro version of this
situation is monitoring in a basement which can be rife with higher Radon
levels, or even an upper room that is closed for weeks on end, both locations
being poorly ventilated. -------------------------- Meanwhile, receiving queries about our Monitoring Stations in Alaska and Hawaii. At the height of the post-Fukushima level of interest, the Radiation Network had about 6 contributing stations from 3 of the Hawaiian Islands, as well as 4 stations reporting from Alaska. One of the Alaska stations is coming back online soon, and we hope the other resting stations will follow. As a reminder, the Radiation Network is a grass roots operation, and this author does not operate any but its own station. Rather, our network of stations is operated by regular people like you who want to contribute, and have or can obtain their own Geiger counter, and plug in. Please contact us if you wish to join the Radiation Network.
The W5RKB Monitoring Station in Northern Virginia recently recorded a spike in radiation levels , followed by some "aftershocks". See the graph at right. He operates an ultra-sensitive pancake-tubed Inspector Alert Geiger counter, situated on the window sill of his second story apartment building, located in a semi-urban, mixed use area very near Dulles International Airport. The exact local time of the 779 CPM spike was 8:59 A.M. EST on April 14th. Winds were 6 mph from the east at the time.
Based upon the graph pattern, this detection appears to be genuine. and
not some sort of glitch. In fact, the pattern of the graph could fit that
of a radioactive patient passing nearby, i.e. a person who has recently
been administered a radioactive isotope as part of a medical diagnostic
procedure, or otherwise a cancer patient undergoing radiation therapy.
This apartment is on the 2nd floor of a 3 story building, and the
station operator plans to do a survey of nearby apartments, including units
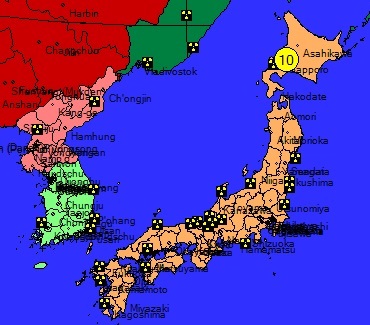
above and below. But at the same time, we can not discount the possibility of a radioactive constituent in the atmosphere, especially when you observe the Jet Stream pattern overhead at that time. Specifically, the slow-moving fringe of the stream was precisely over Northern Virginia in the map at left, which slow speed gives particles an opportunity to precipitate. Interestingly, this same station operator recorded a somewhat similar pattern of radiation detection when located in Texas over a year ago. Read Update 12/14/14.
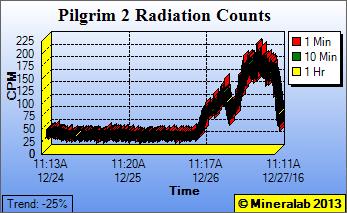
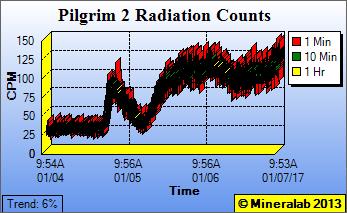
Update: 01/07/17 - Pilgrim Alerts The Pilgrim 2 Monitoring Station in Massachusetts has been detecting elevated radiation levels, first during a two day period late last month, and then more recently, over the last 3 days:
For context, that station is located in Massachusetts, on the west coast of Cape Cod Bay, and about 15 miles SSE of the Pilgrim Nuclear Power Plant. The station operates an ultra-sensitive, pancake tubed PRM-9000 Geiger counter with a normal baseline of about 35 CPM. The detector is logistically situated on a window sill in the second bedroom of a house. You can see that readings during the periods in question reached as high as 150 to 200 CPM, well above the Alert level. The graph pattern shows steadily increasing radiation levels over a multi-hour time span, so we ruled out explanations such as connection glitches and the like. This appears to be a genuine detection from something. Given proximity to the Pilgrim plant, which has had issues recently with steam leaks, we looked for corroboration of the elevated readings from the other 5 monitoring stations in the Pilgrim sub-network, including one station only a couple of miles from the plant, but their readings were all normal over the same period. So our focus turned to local explanations. The station operator indicated that there was no known radioactive material present, nor any persons undergoing medical tests or therapy that would make them temporarily radioactive. We then considered the possibility of Radon accumulation in the monitoring room itself, because the graph shows that familiar pattern. We asked the station operator to ventilate the room while still connected to the Geiger Counter and the Radiation Network, and to record the date and time. That Radon theory proved out because the detected radiation levels began dropping immediately, starting at 10:11 AM Arizona time (12:11 local time) on Dec. 27th (study the first graph above). The pattern of increasing radiation levels repeated itself over the last 3 days, so in consultation with the Pilgrim group, we agreed to take Pilgrim 2 offline temporarily, until a new monitoring location can be found that is not prone to Radon accumulation.
Update: 11/29/16 - Community Monitoring
Similar sub-networks exist within the Radiation Network, including the 11 station Indian Point Group focused around the Nuclear Plant of the same name located on the Hudson River in southern New York state, along with the 4 station Millstone Group surrounding the similarly named Nuclear plant in Connecticut at the east end of Long Island Sound. By working within the umbrella of the Radiation Network, these sub-networks have a couple of powerful capabilities. First, they can use the integrated Chat within the Radiation Network to communicate in real time between Monitoring Stations within their networks, to discuss any Radiation Alerts or the logistics of monitoring. Secondly, a sub-network can create a custom, zoomed-in Map of their monitoring region, just like the sample shown here for Pilgrim, and upload that to their community website, offering real time radiation readings to all interested parties in their respective regions.
Update: 3/28/16 - Florida Wave
The reason for the elevated swings in radiation levels is unknown. Discussion on our live Chat forum has cited Florida nuclear power plants, including the Crystal River Nuclear generating station, located on the Gulf Coast, 120 miles to the southwest, and to pursue that theory, the Raider station is planning a mobile radiation survey around the plant. Perhaps that nuclear plant theory explains the lone spike of 200 CPM. But study the graph, and you will perceive a daily cycle of swings in radiation levels, tending to peak by mid to late morning, followed by troughs in the evening. We have seen these graph patterns before - see updates below for Shell Beach Station 8/2/14 and Post Falls 3/22/14. These wavy patterns are often associated with changing Radon gas levels in the outdoor environment, which can be exacerbated indoors when non-ventilated space allows Radon to accumulate.
Update: 10/21/15 - Apples and Oranges - "Veterans Today" article Have received so many emails with links to a "Veteran's Today" article, that it warrants response. Basically, the author of the article concludes that EPA radiation monitoring stations are recording massively elevated radiation readings compared to the norm, because at least in part, he defines the norm as those background levels detected by a Digilert 100 Geiger counter. Problem is, the EPA stations are not operating Digilert 100 Geiger counters, nor anything close to that, and not all radiation detectors are created equal. True, a Digilert's normal background reading is about the 5 to 20 CPM that the author cites, but the normal readings for an EPA station are many multiples of that. Without going into detail, EPA stations use both larger and specialized radiation collectors, so really, the comparison to the Digilert is not as much apples and oranges, but more like watermelons to cherries. For readers of the Veterans Today periodical, please write in and urge the author to make that correction. He needs to redefine the "norm" for those EPA stations using whatever that number is based on the specific radiation detectors that they operate. Thank you. P.S. While the reporting of EPA data is a good thing, yes, relating their readings to those of our Radiation Network is a problem. One of the attributes of the Radiation Network, among others, is that our station operators use the same Geiger counters that any of us would typically acquire for our own personal safety, or what our first responders in cities like New York are also using, so that the radiation readings detected are very relate-able.
Update: 9/21/15 - False Alert in New Jersey The Oyster Crk 3 Monitoring Station broadcast an Alert this evening which turned out to be false. The station operator had recently undergone a PET Scan and is still radioactive from the imaging tracer. We have disabled Oyster Crk 3 until the effect has worn off. A station is supposed to unplug in such situations, but this one got by - sorry.
Update: 6/25/15 - Radiation detected on Oregon coast
For context , the Geiger counter in use is the ultra-sensitive pancake-tubed PRM-9000. Logistically, the monitoring is done indoors with alternating open and closed windows, while the house is located only 350 yards from the Pacific Ocean. The pattern of the minute by minute spreadsheet activity tends to rule out a software glitch as the cause, and a Radon storm seems unlikely because those graphs typically demonstrate a prolonged wavy pattern. Nor do we believe this was a hardware defect with the PRM, which showed normal readings on its display both before and after the 800 CPM detection. Our best explanation of this genuine Radiation Alert is of Fukushima origin. The actively precipitating fringe of the Jet Stream was roughly overhead at the time, and this looks like a momentary detection of radioactive particles having made their way to the Oregon coast.
Update: 4/23/15, 4:40 P.M. - "Houston, we have a problem."
The station operator explained, "The device was in the same place all the time and nobody visited, nor did I bring anything new into the house during that time. The device also seems to be okay since the reading decreased by itself." The Houston station believes the explanation is weather related, adding that a lot of rain and strong storms had passed through.
So the obvious next question is, "What did the Jet Stream drop over Houston?" Radon daughter products? Fukushima isotopes? Or was this a release from the South Texas Nuclear Power Plant located 75 miles to the southwest? Unfortunately, there was no rainfall at the time, nor air filter collector setup, so no chance to subject collection to the Poor Man's Radioactive Isotope ID test. Some members studied the Jet Stream maps further and traced its origin to south Japan, but in my review, there was a considerable break in the stream. Conclusion: This appears to be a genuine detection, and the graph pattern closely resembles others that are believed to be Radon related, although other constituents can't be ruled out, in the absence of a collectable sample to test.
On the late afternoon of December 4th, a long time running station located in Borger, Texas, northeast of Amarillo, set off our Alert system, recording readings as high as 25,000 CPM!!! In fact, the radiation levels were well into the 000's for so many minutes that the software almost could not keep up. See the graph at right. For context, he is operating the pancake-tubed Inspector Alert indoors from the second story of his home. His normal baseline background is about 40 CPM.
A storm was rolling through at the time, accompanied by rain, and the
Jet Stream
map shows its active precipitating fringe directly over the panhandle at the
time of the alert - see map below. Results: The rainwater was in fact radioactive, starting out around 300 CPM, and its radioactive constituent decayed very rapidly, indicating a half life of a few hours, such that by the following morning, the same rainwater sample measured no more than background. Conclusions: Because of the short half life, many fission by-products can be ruled out, and so the initial tendency would be to implicate naturally occurring Radon washout. However, we have never seen raw environmental readings of Radon daughters this high - yes, commonly in the 00's of CPM, even over 1,000 CPM, but never to our knowledge averaging well into the 000's and in this case, as high as 25,000 CPM. So the working theory we have now, (if not Radon washout), among the station operator and a few of our members involved in the analysis that evening, is a possible detection of some sort of radioactive release from the Pantex plant located only 25 miles to the southwest. Pantex is involved in the disassembly of nuclear weapons at that site. Interestingly, this same Texas monitoring station recorded a possible radiation detection from Pantex on a couple of previous occasions - search the Archives for the Updates of 4/15/13 and 11/24/12.
Thanks again for your support. Tim Flanegin Back to the Radiation Network Click here to go to Archived Messages |
 As the recent false
missile alert from Hawaii, along with North Korea's growing
capability with nuclear weapons, re-focuses our attention on continuous Radiation
Monitoring, I am posting an informative email exchange with a new station operator:
As the recent false
missile alert from Hawaii, along with North Korea's growing
capability with nuclear weapons, re-focuses our attention on continuous Radiation
Monitoring, I am posting an informative email exchange with a new station operator: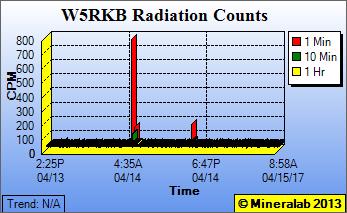 Update:
04/15/17 - Radioactive Patient? or Precipitating Particle?
Update:
04/15/17 - Radioactive Patient? or Precipitating Particle?
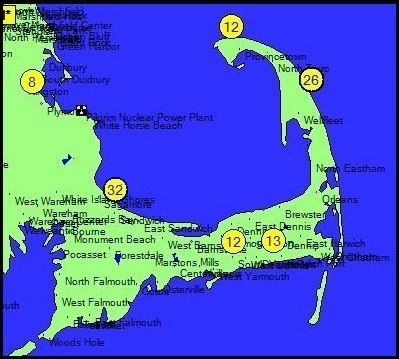 While the Radiation Network offers nationwide, and even global, real time
radiation monitoring, within that umbrella, local Community Monitoring can take
place. As an example, we have a "sub-network" within the Radiation Network
called the "Pilgrim" group which has set up a series of Radiation Monitoring
Stations around the Pilgrim Nuclear Station in Plymouth,
Massachusetts. See the Map at right showing familiar Cape Cod facing
back at the Pilgrim Plant (denoted by the Nuclear Site symbol) on the west shore
of Cape Cod Bay. The Pilgrim group has set up 6 monitoring
stations, consisting of 2 of the Pancake and 4 of the Standard tubed Geiger
counters, strategically surrounding the Pilgrim Plant on all sides.
While the Radiation Network offers nationwide, and even global, real time
radiation monitoring, within that umbrella, local Community Monitoring can take
place. As an example, we have a "sub-network" within the Radiation Network
called the "Pilgrim" group which has set up a series of Radiation Monitoring
Stations around the Pilgrim Nuclear Station in Plymouth,
Massachusetts. See the Map at right showing familiar Cape Cod facing
back at the Pilgrim Plant (denoted by the Nuclear Site symbol) on the west shore
of Cape Cod Bay. The Pilgrim group has set up 6 monitoring
stations, consisting of 2 of the Pancake and 4 of the Standard tubed Geiger
counters, strategically surrounding the Pilgrim Plant on all sides.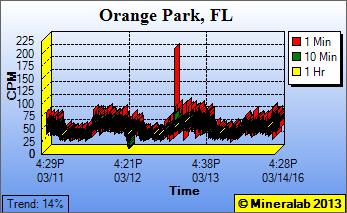 The Raider station on our network, located in Orange Park, Florida, a
suburb of Jacksonville, has been triggering occasional Radiation Alerts
beginning on about March 10th, peaking at 200 CPM on March 13th, as seen
in his graph at right. For context, he is operating a CDV-700 Survey
Meter, but affixed with an ultra-sensitive replacement Pancake probe,
of the same count rate as found in the Inspector line of Geiger counters.
So at his near sea level elevation, it combines for a normal background reading
around 30 CPM. His Geiger counter is logistically setup indoors, on
a south facing window sill.
The Raider station on our network, located in Orange Park, Florida, a
suburb of Jacksonville, has been triggering occasional Radiation Alerts
beginning on about March 10th, peaking at 200 CPM on March 13th, as seen
in his graph at right. For context, he is operating a CDV-700 Survey
Meter, but affixed with an ultra-sensitive replacement Pancake probe,
of the same count rate as found in the Inspector line of Geiger counters.
So at his near sea level elevation, it combines for a normal background reading
around 30 CPM. His Geiger counter is logistically setup indoors, on
a south facing window sill.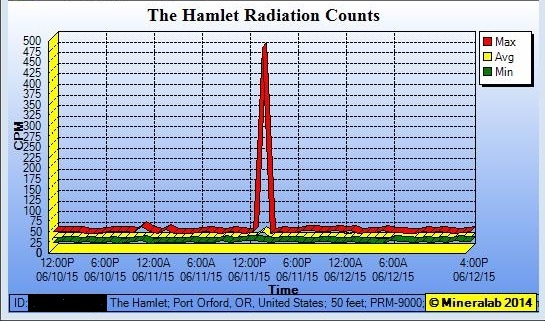 During
the early afternoon of June 11, a station in Port Orford, Oregon
momentarily detected a radiation level as high as 800 CPM. The
elevated levels lasted not more than a couple of minutes, but surged well into
the hundreds of CPM against a normal background reading of about 26 CPM.
During
the early afternoon of June 11, a station in Port Orford, Oregon
momentarily detected a radiation level as high as 800 CPM. The
elevated levels lasted not more than a couple of minutes, but surged well into
the hundreds of CPM against a normal background reading of about 26 CPM.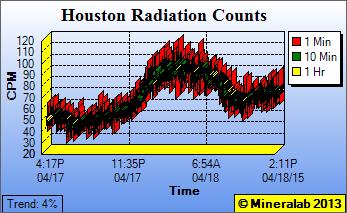 During
the evening of April 17th, a Monitoring Station in Houston, Texas set off the
Alert system of the Radiation Network, detecting counts as high as 120 CPM,
versus its normal background reading of 33 CPM. The station operates the
Inspector+ Geiger counter, an ultra-sensitive pancake-tubed
model, logistically set up indoors at the time. You can see from
its graph that the ensuing radiation detection over the following day or
so exhibited a wavy pattern, finally subsiding to normal readings after
about two days.
During
the evening of April 17th, a Monitoring Station in Houston, Texas set off the
Alert system of the Radiation Network, detecting counts as high as 120 CPM,
versus its normal background reading of 33 CPM. The station operates the
Inspector+ Geiger counter, an ultra-sensitive pancake-tubed
model, logistically set up indoors at the time. You can see from
its graph that the ensuing radiation detection over the following day or
so exhibited a wavy pattern, finally subsiding to normal readings after
about two days.  A check of weather at the first alert indicated
no rain at the time, however,
the Jet Stream was passing above Texas, parting into two fingers directly over
Houston. We have seen other elevated radiation detections on our network
apparently correlating with the active
fringes of an overhead jet stream, so that seems to be the best explanation.
A check of weather at the first alert indicated
no rain at the time, however,
the Jet Stream was passing above Texas, parting into two fingers directly over
Houston. We have seen other elevated radiation detections on our network
apparently correlating with the active
fringes of an overhead jet stream, so that seems to be the best explanation.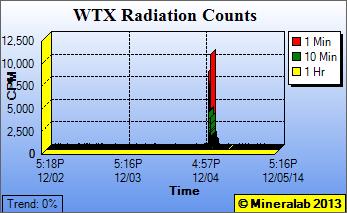
 Wind was from the south. The fact that it was raining set up an opportunity to collect a water sample to
confirm that the radiation was related to the storm. So the operator did
successive 10 minute average scans of the exact same sample of rainwater to
first confirm its radioactive nature, then secondly to measure its radiation
level, and thirdly (and of critical importance) to measure the decay rate to to
the end of ruling in or out various isotopes of known half life. i.e. the "Poor
Man's Isotope Identifying Test", using a Geiger counter.
Wind was from the south. The fact that it was raining set up an opportunity to collect a water sample to
confirm that the radiation was related to the storm. So the operator did
successive 10 minute average scans of the exact same sample of rainwater to
first confirm its radioactive nature, then secondly to measure its radiation
level, and thirdly (and of critical importance) to measure the decay rate to to
the end of ruling in or out various isotopes of known half life. i.e. the "Poor
Man's Isotope Identifying Test", using a Geiger counter.