![]()
|
|
|
Archived Messages from 8/10/13 to 8/2/14, listed in reverse chronological order:
Below are the results and analysis of a number of tests run by the Shell Beach station in an attempt to explain his elevated readings:
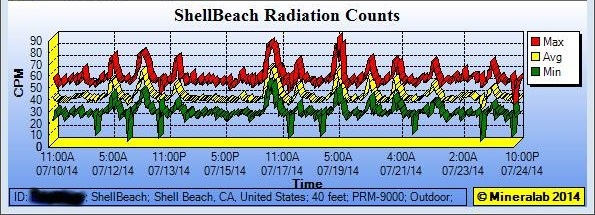
Discussed in more detail later, at right is a new Historical Graph
generated by our GeigerGraph software.
Analysis: The series of tests run by the station operator have enabled us to partially rule out a number of potential causes for what remains as occasional elevated readings from his outdoor Geiger counter. The specifics of Shell Beach's location "perch" him on a bluff or cliff directly above the beach where he is immediately exposed to marine layer air masses. Perhaps these contain an above normal and fluctuating Radon content? Certainly, other monitoring stations on our network using similar pancake-tubed Geiger counters have shown particular sensitivity to what we believe to be Radon in passing weather. The Radiation Network is 10 years old now, and we are over 3 years post-Fukushima, which event triggered much growth in our network. Through the combined efforts and contributions of hundreds of monitoring stations over these years, we have added significantly to our knowledge base in the field of radioactivity in our environment. This marine layer theory, if eventually proven, could be the latest addition.
Latest: 5/30/14, 9:45 A.M. - After a 4 to 5 day interval of subsided readings, Shell Beach has returned to sustained elevated readings above 100 CPM, and issuing Radiation Alerts. The PRM-9000 was relocated to a new apartment in the same complex, next to an open window to rule out possible detection from any radon accumulation inside the apartment, and away from any stone countertop or collecting air filter. Station operator had submitted documentation of earlier elevated readings to nearby Diablo Canyon nuclear power plant, but no response yet. Action items for next week:
His monitoring room's windows were closed, so to rule in or out a Radon gas accumulation, he moved his Geiger counter outdoors onto a deck, but the readings remained elevated for 20 minutes or so. Eventually, his detected radiation levels slowly subsided to his normal baseline of 35 CPM - see graph at right. For what it is worth, I believe the station operator mentioned a HEPA filter in operation at his location. Summary: This appears to be a genuine detection, and not a false alert. To the extent it may be relevant, the Shell Beach station is located about 4 miles east of the operating Diablo Canyon Nuclear Power Plant. Could the Monitoring Station have detected some sort of release from the plant? To explore this, the graphs and spreadsheets from our software can at least serve as documentation of an elevated radiation level in close proximity to the plant. Their Date/Time Stamps will help correlate with any related activity at the plant. The other explanation of Shell Beach's alert level, based on the graph pattern, could be the passing of a local radioactive weather pattern, as we have often seen with other monitoring stations. Such phenomena is sometimes, but not always associated with precipitation, but is often related to an overhead jet stream pattern. In the case of Shell Beach, weather conditions were clear. The Jet Stream map at the time of the elevated levels showed a "detached" portion over Southern California, and we know that airborne particles have a chance to fall from the jet stream along its fringes. As a reminder, a radioactive weather pattern can be either naturally so from its decaying Radon gas constituent, or artificially radioactive from manmade causes. Only an isotope analysis can distinguish between the two.
A new station on the Radiation Network is issuing Alert level radiation readings as of this morning, exceeding 100 CPM (counts per minute) for an extended period of time. See the graph at right. He is monitoring from Shell Beach on the California coast, northwest of Santa Barbara. For context, his Geiger counter is a PRM-9000, an ultra-sensitive Pancake-tubed model, and logistically, his monitor is set up indoors. His normal background reading is about 35 CPM. We do not know the cause of the elevated levels at this time, but until we get more information, have no reason to believe these are not valid readings, so the monitoring continues. Once we obtain more information from the station operator, we will do a follow-up report.
Epilogue: 03/22/14, 10:00 A.M. - Post Falls, ID alert
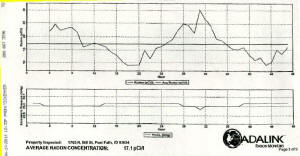
Interesting conclusion to the Post Falls , Idaho radiation alert from 12/23/13 - Station operator commissioned a professional Radon test, which did in fact confirm that his monitoring environment was radon infested, showing a reading of 17 picocuries/liter versus a normal standard of 4 pCi/l or so. The test was performed over two days using an electronic Radon monitor which simultaneously tracked barometric pressure. The bottom of the two graphs at left shows Radon levels on the top graph line, and barometric pressure on the bottom graph line. You can see that as barometric pressure dropped, which happens when a low pressure weather pattern moves through, the Radon levels rose. Meanwhile, the station operator ran his PRM-9000 Geiger counter simultaneously with the Radon test. Look how perfectly the radioactivity levels shown on the colored graph at top tracked with the Radon levels being monitored by the electronic Radon sensor. So the Radon monitor turns out to have been an excellent corroborating instrument for the PRM-9000.
Since that time, the station operator instituted Radon mitigation, and ever since, his readings have fallen to relatively normal levels, and he is back online now, reporting an average of 54 CPM, not unexpected for a pancake tubed model at his 2,300' elevation. The Radiation Network has seen other monitoring stations show a similar graph pattern, especially when running a pancake-tubed model, probably relating to its ultra sensitive alpha detection, which makes sense because the Radon decay process generates a significant alpha emission, I am told.
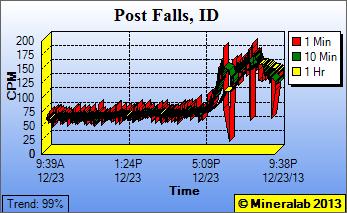
Update: 12/27/13, 7:40 A.M. - Station operator took himself offline to conduct some specific tests in the last couple of days. Most everything he scanned for 10 minutes each read pretty normally - kitchen wood/formica counter at 61 CPM, shoes at 71 CPM, another rainfall test (paper towel swipe of car) at 62 CPM. But here is the very telling experiment - a 10 minute outdoor background count 20" off the ground which read at 61 CPM - close to normal background for his high count rate pancake-tubed Geiger counter at his 2,300' altitude. This test was necessary to remove the Geiger counter completely from any specific substance and/or indoor environment that may have contributed to his continuous 100+ CPM readings on 12/23, and assure that the Geiger counter itself was not contaminated. But here is the next interesting part - after the above tests, he plugged his detector back into his computer for a logged and continuous monitoring again from indoors, and after many hours, he reports his graph showed the same elevating pattern, peaking at a sustained level above 100 CPM. So this most likely points to a radon gas infested environment indoors, as opposed to a passing radioactive weather pattern. I would add that he monitors from a one story house with basement, where the two sections are connected via a door-less doorway. To confirm the radon theory, the plan is to ventilate the kitchen from where he is monitoring, confirm readings subsided to normal, then close up the house, and plug back into the network so we can remotely watch if his graph re-elevates over a period of time again. So stay tuned. Follow up: 12/24/13, 8:10 A.M. - Spoke with the station operator this morning. He states that the rainwater scan was conducted independent of these elevated readings, so we are still investigating the cause. We want to rule out possible explanations like a contaminated instrument, a contaminated operator, or a local indoor radioactive environment, so station operator will do a timed background count outdoors later today. Until then, he took his station offline. Hopefully, his outdoor count will reveal his normal background for the pancake-tubed PRM-9000 at his 2,300' altitude of about 55 CPM. If not, we'll need to consider either the contamination explanations, or a radioactive environment that moved into his area.
A new station in Post Falls, Idaho is alerting at levels over 100 CPM as I write this. We are trying to establish the reason - it may be the station is doing a scan of captured rainwater while still plugged in to to the network. We will try to confirm this in the morning.
The Radiation Network has been transitioning some new features in over the last few months. To review, we are an equal opportunity Network, i.e. almost any model of Geiger counter is welcome to contribute its readings. But most of us now know that not all Geiger counters are created equal. This historically presented a problem in establishing both a common and meaningful Alert level for stations on the network. In the past, we just used a simple 100 CPM level, however, that resulted in our "lower count rate" stations typically being 'left out' of most alerts, i.e. those stations would have to detect elevated levels perhaps seven times background before alerting. So we have now adopted a more precise Alert level which you can see foot-noted under the Map on the main page and repeated here: 3 consecutive minutes of the lesser of 100 CPM or 2.5 times a Station's baseline The simulated Alert level symbol on the Map inset at right shows how a low count rate station can alert at less than 100 CPM, so be on the lookout for that. The idea behind requiring 3 consecutive minutes of alert level readings to actually issue an alert is to filter out stations exhibiting momentary spikes which usually relate to connection glitches and the like. In general, what really matters in radiation detection are elevated levels that are sustained. As the courtroom judge often says, "Sustained!"
Update: 8/21/13, 7:45 A.M. - Dangerously high Radiation levels at Fukushima A Japanese news agency is reporting that readings of 100 mSv/hr are being emitted from leaking tanks of contaminated water at the Fukushima nuclear power plant. Let's put that reading in context. First of all, the dose rate of mSv/hr stands for milli-Sieverts per hour, or one thousandth of a Sievert/hr. In contrast, typical background readings at sea level approximate .1 µSv/hr, expressed as .1 micro-Sieverts/hr. The micro-prefix stands for one millionth, so if my math is correct, the readings of the leaking water therefore amount to 1 million times normal background levels!!! Beyond the obvious point of the story, what I would offer is that when communicating readings of radiation levels, it is not enough, and is even irresponsible to report just a number, like 100. The number must always be accompanied by the applicable unit of measurement, such as 100 milli-Sv/hr or 100 CPM. And in this business, decimal places also matter. I pass on this reminder because in the early days of the Fukushima disaster, it was common for readings to be mis-reported. By now though, most of us understand that radiation dose levels can be expressed in a variety of units.
For the record, I am posting graphs and descriptions of a few recent alerts over the last couple of weeks. The Anchorage station on July 25th was operating an Eberline model with pancake tube, set up outdoors and shielded from direct sun. The station operator is not sure of the cause for the steady rise in radiation levels, indicating that weather conditions were particularly hot and sunny during the elevation. Otherwise, the graph pattern resembles that often generated during passing storms.
At left, the Greensboro, NC station was operating a standard tubed
Monitor 4 on July 28th when his average background count of 10 CPM
gave way to a 3 minute surge of 352, 545, and 760 CPM, then just as
quickly subsided to normal levels.
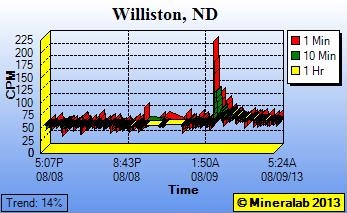
Then just yesterday, August 9th, the Williston, ND station broadcast an alert, exceeding 200 CPM against his normal background of 49 CPM. He operates the PRM-9000, an ultra-sensitive pancake tubed Geiger counter. No feedback yet from the operator as to an explanation. In case it is relevant, Williston is ground central for the recent oil boom surrounding the rich Bakken geological formation. On a related matter, many of you email for an explanation of the chronically high reading in the Pennsylvania/New Jersey area. This is a station located in Philadelphia, running the high count rate Inspector model. The station's average is, and has been from the beginning, about 59 CPM. This is unexpected - near sea level, the Inspector would normally read about 35 CPM. Thus far, I have still received no response from the Philly station.
Thanks again for your support. Tim Flanegin Back to the Radiation Network Click here to go to Archived Messages |
 Shell Beach Station - Final Report:
08/02/14, 10:30 A.M.
Shell Beach Station - Final Report:
08/02/14, 10:30 A.M.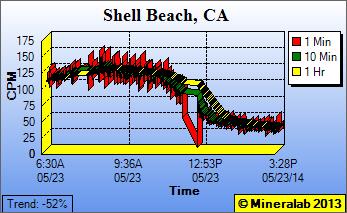 Follow
Up: 5/23/14, 5.05 P.M. - Communicated directly with station operator.
His indoor location is on a second story of an apartment complex, with
the PRM set upon a desk with an onyx over wood top, close to a west facing
window. As a check on the instrument/software integrity, the PRM-9000's
display was also indicating current readings at the same elevated level as
shown in the software.
Follow
Up: 5/23/14, 5.05 P.M. - Communicated directly with station operator.
His indoor location is on a second story of an apartment complex, with
the PRM set upon a desk with an onyx over wood top, close to a west facing
window. As a check on the instrument/software integrity, the PRM-9000's
display was also indicating current readings at the same elevated level as
shown in the software.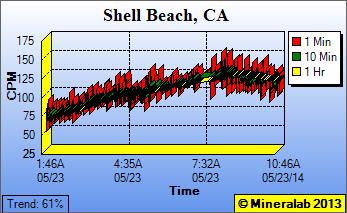 Update:
5/23/14, 11:00 A.M. - Radiation Alert in Southern California
Update:
5/23/14, 11:00 A.M. - Radiation Alert in Southern California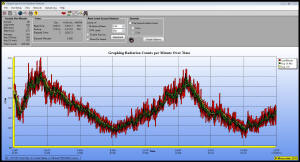
 Update: 12/23/13,
9:45 P.M. - Testing Rainwater online?
Update: 12/23/13,
9:45 P.M. - Testing Rainwater online?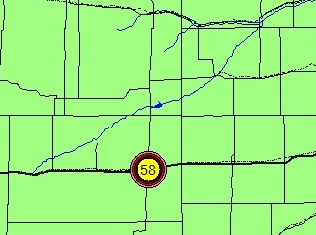 Update: 11/6/13,
6:30 A.M. - New Alert Level activated
Update: 11/6/13,
6:30 A.M. - New Alert Level activated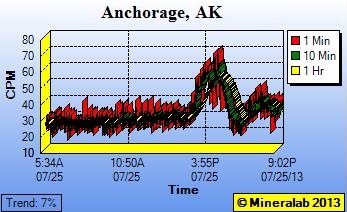 Update:
8/10/13, 8:00A.M. - Recent Radiation Detections/Alerts
Update:
8/10/13, 8:00A.M. - Recent Radiation Detections/Alerts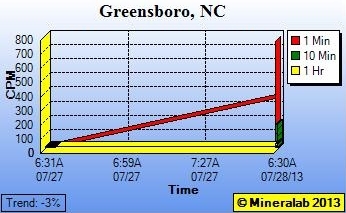 This pattern could be explained by brief handling of a radioactive sample, or
momentary passing of a human still radioactive from a medical test, but the
operator claims neither. Logistically, his detector is facing out a second
story window toward an airport, with clear skies at the time - cause unknown.
This pattern could be explained by brief handling of a radioactive sample, or
momentary passing of a human still radioactive from a medical test, but the
operator claims neither. Logistically, his detector is facing out a second
story window toward an airport, with clear skies at the time - cause unknown.