
![]()
|
|
|
Update: 3/17/12, 12:00 P.M. - Recent Radiation Alerts
For context, Bangor's detector is a standard tubed Monitor 4 Geiger counter recently built from a kit . He was monitoring indoors in his single family home. The Station owner indicates he knows of "nothing in the house that would cause this unless my Monitor 4 counter is going bad?", but offered that he "gets these readings every time I have the basement window open. I walked around outside and did not find anything. Wind again was from the west. I am going to talk to my neighbor, to the west - he works demolition at different sites in New York City. I am going to take it off line until I figure out what is going on." My analysis: In my years of experience in continuous radiation monitoring, this alert looks very much like one or two seen on the Radiation Network as a result of the station operator approaching too closely to the detector, having recently undergone radiation therapy or a medical diagnostic test involving radioactive isotopes injected into the blood stream. These isotopes typically have short half lives of a few hours or days, but until they fully decay, the human patient is often highly radioactive. Having said that, Bangor responds that "no one here was exposed or had any nuclear tests", so....
Update: 3/11/12, 5:15 P.M. - Fukushima Anniversary - What we have learned... Reflecting on this 1 year anniversary of the Fukushima disaster, here are a few observations, some of which are obvious, but which still bear repeating, and others not necessarily apparent to the novice in this specialized field of radiation detection:
Update: 3/10/12, 10:45 A.M. - Solar Flare - Out! Over the past couple of days, a large Solar Storm or CME (Coronal Mass Ejection) blasted Earth, and given that the Radiation Network is continuously monitoring environmental radiation among close to 60 stations, the question was whether we were going to detect an elevated level. Well, we did not, at least not of any obvious discernable amount. Our average readings on Thursday, when the Solar Storm peaked, ranged from 22 to 23 CPM (Counts per Minute) which is normal among our varying mix of Geiger counter models. Beyond that, a number of individual stations who were plotting radiation against their normal background reported no elevated levels. Because cosmic radiation, such as that emitted by our Sun, is easily strong enough to pass through the walls of most structures, even our indoor monitoring stations could have potentially registered elevated levels from a sizable solar storm. I am no scientist, but my theory is that as intense as this passing solar storm was, its combined energy, as a percentage of normal cosmic radiation that constitutes much of our background, was just too small to make a noticeable difference. But this event provides a good opportunity to visit this general subject. Many lay persons may not understand that our Sun and all of the other stars are nuclear reactors (of the fusion type) along with Fukushima - it's just that they are naturally occurring, and completely uncontrolled. Science fiction fans of the Jules Verne classic, 20,000 Leagues Under the Sea, may remember the term that Captain Nemo used to describe the energy source of the Nautilus - the "Power of the Universe". Well, that is nuclear power. A related topic to this is the Electromagnetic Spectrum, one of those elegant constructs of science, like the structure of the Periodic Table of Elements, that tells us so much in such a concise format. That spectrum ranges across multiple forms of electromagnetic energy whose fundamental difference is their respective frequencies and wavelengths, which are inversely related. On one end of the spectrum are the high frequency, short wavelength Gamma and X-Rays, and at the opposite is the low frequency, long wavelength radio waves. In between are ultraviolet light, visible light, infrared, and microwaves. Among this group, the only forms of radiation that are "ionizing", or what we normally refer to as "radioactive", are Gamma and X-Rays, so are therefore the only types of radiation within the electromagnetic spectrum that are detectable by a Geiger counter. For those interested, here is a wikipedia link: http://en.wikipedia.org/wiki/Electromagnetic_spectrum
Update: 2/05/12, 9:40 A.M. - Private Network open to the Public Some viewers asked about high readings in Virginia on 2/2/12, from stations denoted on the map by a White Circle. That designation signifies a Sim, short for Simulation, meaning those stations did not have a Geiger counter connected, and instead were running a Simulation to demonstrate the action of a typical Geiger counter, including at elevated levels in some cases. In short, the readings were not real. Study the Map Legend at the bottom left corner of the map. This brings up a point which some viewers may not understand. While the Radiation Network is privately owned and operated, it is nevertheless open to the responsible public. All you need do is make a one time purchase of the underlying GeigerGraph Software that runs the network. Many of you have shown strong and loyal interest in our network, so you might consider joining, even if you do not have a compatible Geiger counter. To review, membership in the Network gives you access to a fully interactive Radiation Map of all countries, with zoom and other navigation features, clickable ID of Monitoring Stations and Nuclear Sites, real time access to minute-by-minute Radiation Count data for every station, and participation in an integrated Chat with other Network members to discuss radiation levels, interpretation of alerts, logistics of monitoring setups, etc. Once you become a member, you will never need to return to the live web page anymore, because you will do all of your monitoring within the powerful and information-laden software itself. So please feel free to join our Network, even if you don't have a Geiger counter at present. Thanks.
Update: 1/25/12, 7:30 A.M. - Follow up to Taos Alert Since the Taos alert, others have chimed in, including PotrBlog, who first corrected me on the jet stream flow, and then offered an interesting theory in explanation of the elevated detection. See this youtube link for full details: https://www.youtube.com/watch?v=P015zuShnUg&feature=share PotrBlog suggests that the Taos radiation detection is Fukushima based, related to a nearby earthquake occurring on about January 11th, then carried by the jet stream, the southern edge of which flowed over Taos. Contrary to my instinctual thinking, PotrBlog maintains that the fallout zone of jet stream borne radiation is not the high speed center of the flow, but instead along the relatively slower and rippled edges, which in this case, positioned right over Taos. Without taking a stance on PotrBlog's theory, I find it interesting and wanted the rest of you to be aware of it. Update: 1/19/12, 11:30 A.M. - Radiation Alert from Taos
For context, the station is operating the Inspector Geiger counter, which is a high count rate model built around an ultra-sensitive pancake style Geiger- Mueller tube. Between that high count rate, and the high elevation of Taos at 7,300 feet, their background count of about 60 CPM is therefore considered normal. During the alert period, the station reports they were monitoring indoors on the second floor of an adobe structure, with the instrument sitting on the bed, monitoring the environment only - no specific materials were being scanned at the time. A few minutes of outdoor monitoring preceded the graphed activity shown above, which readings were also elevated. It was neither raining nor snowing at the time, and the wind was still, against relatively clear skies, although the station reported a "heavy orange cloud" on the western horizon at dusk, reminiscent of an LA sunset that is color enhanced by smog. So what was the cause? In short, we don't know, but the fact that the elevated radiation levels were sustained for many minutes, versus a momentary spike, and then fell back to normal levels, tends to rule out a false alert that our network occasionally generates from an instrument glitch or the like. A jet stream map from last evening located the flow too far north to be a factor, its southern edge dipping down only as far as Colorado. Did the orange cloud somehow relate to the elevated radiation levels? Was there a passing radioactive "plume" from Japan? Or perhaps a downwind release from Los Alamos National Lab to the west? These are speculative questions only. A greater number of Monitoring Stations would provide a chance to corroborate readings, so that must be the continuing mission of the Radiation Network. Update: 11/27/11, 9:00 A.M. - Radioactive Rain - Natural or Contaminated?
To review, the Geiger counters that drive the Radiation Network give only a total radiation count, and lack the ability to identify by isotope, and given that the presence of certain isotopes provides a clue to the source of radiation, we have been unable to say whether these radioactive rainfall detections are Fukushima in origin, or naturally occurring. But this is all changing as of recent. We now have 1 to 2 stations on our network investing in the analytical tools needed to determine isotope content. This is specialized and expensive equipment that combines a Gamma Scintillation Detector with a Multi-Channel Analyzer, to perform Gamma Spectroscopy and quantify energy levels. These measured energies serve as a sort of fingerprint or DNA marker for each isotope, so for instance, a naturally occurring component of rainfall like a Radon gas daughter product will show a different signature than will an Iodine-131 contaminant. Wikipedia has a pretty good article on this for those wanting greater detail: http://en.wikipedia.org/wiki/Gamma_spectroscopy So the plan is to use this diagnostic equipment to analyze rainwater, soil, and food samples for Radiation Network members, at least for starters. We will report what we find, so stay tuned. I should acknowledge that other institutions are already conducting this type of analysis, so what comes out of this network should be considered an additional and independent source beyond Government agency or University research.
Update: 10/30/11, 6:30 P.M. - Radiation Report from Japan Some viewers of the Radiation Maps on our Network wonder why radiation levels in Japan seem to be lower than those in the US in some instances. For example, of the stations in Japan reporting in real time as I write this, their average readings are about 14 CPM (Counts per Minute), in contrast to some stations in the US showing levels in the 30's and 40's. Well, the explanation of that difference is simple. First of all, our network is fed by readings in CPM because that is what almost all of the contributing detectors send out of their data ports, and as we have stressed many times, not all detectors are equal in the design and size of the sensor, or GM (Geiger-Mueller) tube that they are built around. It just so happens that most of our Japan stations use "standard tubed" Geiger counters, while many stations in America use the ultra-sensitive pancake-tubed detectors, which have about a 3 to 1 higher count rate than standard tubes. So whenever you see readings in the 30 or 40's, it is usually because the station is running a pancake tubed Geiger counter. Unfortunately, that has led to some understandable confusion, but you see, the Radiation Network is an equal opportunity practitioner, i.e. we allow almost any model of radiation detector to contribute to our network - we are non-discriminatory. But because of the differences, we need to do a better job of providing context for the readings. A future version of the underlying software that runs the network will incorporate a technical database of the different models of compatible detectors, and offer an "Equalizer" function for those who want to try to adjust for the different GM tubes in the various Geiger counters. But back to Japan. Those average readings of 14 CPM are from sea level stations monitoring indoors, located in the Tokyo/Yokohama metroplex, as well as the Sendai area farther north and closer to Fukushima. So what conclusions are we to draw from those readings? Well, unless one ventures into the evacuation zone around Fukushima, environmental radiation levels elsewhere in Japan are pretty normal to slightly elevated. We have said before that one must be within 20 to 60 miles of a Fukushima like emission to get an elevated detection just "in the air". Having said that, many reports come back from Japan about elevated radiation levels from rainfall, along with hot spots of soil contamination. Here is one such study from one of our stations in Yokohama - "These are all averages of 10 minute total Counts Per Minute as measured by the CRM-100 around our apartment."
"In conclusion, radiation tends to be slightly lower inside than outside, and very small hot spots are being created around ditches and other drainage areas. This is also reasonably consistent with other experiments at a nearby park where I saw a radiation drop from 20 to 30 CPM, to less than 10 CPM when I entered a metal tower (without open windows)." Thanks to our "Yokohama Rad" station for this report. He added that an increasing number of radiation maps are finally being released, which tend to show radiation apparently scattered by the wind. The data generated by the folks at safecast.org includes a couple of maps that show the radiation they measured as they drove through Fukushima Prefecture. Definitely check out safecast because the number of their data points is quite large.
Update: 10/9/11, 6:15 P.M. - Another Real Time Rainwater Scan
Look at the graph below, from 9/19/11. Overlaid on top is a
third party weather program showing rainfall (bright green) in the Seattle
vicinity at the same time that he was monitoring outdoors with his
rainwater capture feature. Notice the ebb and flow of radiation levels,
which rose as high as the 90's in CPM (Counts per
Minute), about 3 times his normal background of 32 CPM. Interestingly, his
elevated readings were just below the Radiation Network's 100 CPM Alert level. As to the details of Seattle's setup, he is using the Inspector pocket Geiger counter, the one with the high count rate GM (Geiger-Mueller) tube, seen in the top photo, laying flat in the center of the feature, protected from direct overhead rainfall. The sloped contraption above is the rain collector and guides the water to a reservoir underneath the Inspector's GM tube, which is on the back, or bottom of the instrument when laid flat. That reservoir has a seep hole for water to drain out and make way for a new sample.
Meanwhile, the feature incorporates vents to allow free flowing air
to pass under the detector, for picking up possible contamination. Because
of the rainy and humid environment synonymous with the Pacific Northwest,
Seattle has affixed a heater to add a drying process to control dew.
And all this while Seattle is connected in real time to the
Radiation Network,
In summary, the Seattle WA station is detecting radiation in his rainwater, and on more than one occasion. To review, there can be a naturally occurring radioactive constituent to rainfall, namely daughter products of radon gas that make up part of the atmosphere, and according to one expert, also tritium. What we don't know is whether those are the only cause of Seattle's radioactive rainfall, so this detection setup is only a first step. On a lighter note, beyond the functionality, when you look at Seattle WA's construction from a different angle, it seems worthy of Best in Show within the category of Outdoor Sculpture, from the School of Industrial Arts :-)
Update: 9/17/11, 10:30 A.M. - More Nuclear Sites Based on feedback from network members and other interested viewers of the Radiation Network, I just added a few more nuclear sites to the Radiation Map, as follows:
Thanks to all of you who contributed to updating our Nuclear Site database.
Update: 9/15/11, 9:00 A.M. - "American in Paris", er uh "Paraguay"!!! We just added a Radiation Map for South America because we have a new Monitoring Station in Paraguay of all places, operated by an American. But beyond the surprise, we heartily welcome him. His station represents the first on our Network from the Southern hemisphere, which may be relevant. So check out the new map.
Update: 9/10/11, 11:30 P.M. - NYC well equipped As the nation plans for the anniversary of 9/11/01, the task is twofold - to both memorialize, and to guard against another attack. In the aftermath of that tragedy 10 years ago, when most Americans deemed the possibility of a repeat attack quite high, New York City was preparing. They contacted us in search of radiation detectors for their first responders, and we worked with the manufacturer, International Medcom, to furnish 500 units of the Radalert 50 Digital Pocket Geiger counters to the NYC Fire Department, in a transaction privately funded by the Centurion Foundation of New York City, chaired by Albert Fried, Jr., a long time supporter of New York's finest. The Radalert 50 has since been succeeded by the Radalert 100, but it is perfectly suited for first response - compact and wearable on an officer's belt, yet all-around in capability, with a standard Geiger-Mueller tube capable of detecting Alpha, Beta, and Gamma radiation, along with a programmable audible alert feature. But unlike the civil defense models of circa 1960, which were geared quite high in operating range commensurate with expected radiation levels from a nuclear exchange between the superpowers, the Radalert and most modern detectors are far more sensitive on the low end to meet today's requirements such as dirty bomb detection. To review, a dirty bomb is not a nuclear device, but rather a conventional explosive surrounded by radioactive material, which could be anything from medical waste to uranium ore. So its range is only as far as that of a conventional bomb, perhaps a hundred yards immediately, but airborne particles could extend that perimeter much farther. So within that zone, the Radalert should be capable of detecting the corresponding radiation. While a dirty bomb is quite dangerous, especially from the explosive impact, and while the radiological dispersal would require an extensive clean-up effort, relative to a genuine nuclear bomb, a dirty bomb is mainly a weapon of terror. God forbid we ever witness this, but in such case, NYC and most other major cities are well equipped to immediately detect this type of hazard so that they can control exposure.
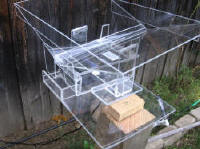
Update: 9/10/11, 9:15 A.M. - Detecting Radioactive Rainwater in real time
As orientation, this is the same Station that we previewed as a model of Outdoor Monitoring - scroll down to the 4/22 Update. Remember, his ultra-sensitive pancake tubed Inspector Geiger counter is safely strapped to the underside of the lid of this cooler, with the end window of the GM tube pointed downward.
Remember, this detection system operates while his Geiger Counter is still connected to the Radiation Network, thus the real time component. So once again, the "acomfort" Monitoring Station has led the way in modeling an optimal and relevant outdoor radiation monitoring system of the kind that you and I can easily build, and we should commend him for this. So what is the value of detecting radioactive rainwater in real time? A number of youtube videos are showing scans of alleged rainwater, in a few cases over 1,000 CPM !!!, but after the fact. Not that those experiments are illegitimate, but a detection in real time, in contrast, is more difficult to manipulate than a later analysis, if that were one's agenda, so real time detection adds credibility to the system. In addition, acomfort's detection was made while connected to the Radiation Network, where other members were able to follow his minute-by-minute radiation counts through his Remote Graph and Spreadsheet, while the elevated levels were being recorded. As to the relevant danger from this contaminated rainwater, if any, I will leave that to the experts for now.
Update: 9/7/11, 1:30 P.M. - Radiation Alert in New Mexico A new Monitoring Station in Taos, New Mexico broadcast a Radiation Alert in the early afternoon today, averaging about 150 CPM, and sustained for many minutes. Normal background for that station is 64 CPM, high to start with because of the 7,500 foot altitude in Taos, and also because the Geiger Counter in use is built around the same ultra-sensitive pancake GM tube used in the Inspector line of detectors. The Station asserts it was scanning captured rainwater from an outdoor picnic table, harvested with a paper towel, then brought indoors, set on a paper plate, laid in turn on top of a piece of styrofoam, then sitting on an oak table. This is a very high reading for captured rainwater compared to similar scans known to have been performed under conditions that pass scientific muster. We can not independently verify these readings, but remain open. Generally, experiments are to be done while disconnected from the network, so for the time being, until the experimentation is over, we have disconnected the station.
Update: 9/2/11, 9:30 A.M. - Radiation on Airplane Trip
I recently flew round trip from Phoenix to Milwaukee, and recorded the radiation
counts on the return flight using a new Geiger Counter model,
the PRM-8000,
As orientation, the normal background count for the standard-GM tubed PRM at base elevation of 634 feet in Milwaukee was 16 CPM (Counts per Minute), versus the Phoenix experience of 19 CPM at 1,124 feet elevation. Studying the graph, first note the spike in radiation at the beginning of the trip. The PRM was being scanned by the X-Ray machine as part of carry-on luggage, and for that minute, averaged a radiation level of 2,130 CPM. Once the Boeing-737 took off, background radiation climbed in unison with the plane's altitude, and by the time the airliner leveled off, probably at around 40,000 feet, radiation had peaked at 511 CPM, and was averaging 423 CPM, or about 25 times normal background. When you think about it, this experiment all but proves that the primary source of ever-present background radiation on Earth is cosmic in origin. The farther that a Geiger counter travels away from the surface of the Earth, the greater the background radiation count because of the lesser atmospheric and electromagnetic shielding at higher altitude. This experiment should also put to rest a myth held by a few that the source of our background count is the radioactive remnants from circa 1960 above-ground nuclear testing in Nevada and the Soviet Union. Not that such detonations were, or are not, a component of background, but in magnitude, they pale in comparison to the strong cosmic ray constituent. So how harmful is radiation from plane flights? For the PRM-8000, a radiation level of 423 CPM equates to .423 mR/hr, so the total round trip flight time of 7 hours contributed toward my annual radiation dosage by the amount of about 3 mR. Since the NIH (National Institute of Health) recommends limiting annual radiation dosage to no more than 100 mR, over and above normal background radiation, that would correspond to 33 such flights per year. I rarely fly, but you can estimate the accumulated dosage that our dutiful flight crews receive over the course of a year of service. Some might wonder if taking a radiation detector on a commercial flight is allowed. Neither the TSA nor most airlines have such a prohibition. Of course, any one security officer could still question it, so you might have along an operation manual or invoice as documentation. By now, 5 months after Fukushima, I would imagine most TSA personnel are trained on this, given a number of American residents who are taking radiation detectors on flights to Japan. A cautionary note - if you do take a radiation detector in carry-on to observe the high radiation count in flight, I advise discrete monitoring - turn off any audible clicking or beeping so as not to alarm passengers nearby.
Update: 8/28/11, 10:10 A.M. - Server Upgrade To support growth of the Radiation Network, we are upgrading the server on Sunday, August 28th. The Network will be down from time to time during that period. Thank you for your patience.
The underlying software that runs the Radiation Network provides not only for permanently located Monitoring Stations, but also Mobile Monitoring Stations, and we were treated to a show of this last week. The Seattle WA station led us on a trip to Portland, Oregon, the first leg of which can be seen on the map at right. When a station goes mobile, its yellow circle grows an arrow, indicating direction of travel, and it leaves a red-lined GPS trail in its wake.
During the course of a mobile radiation monitoring journey, the software program combines the above data with a minute-by-minute radiation count, all recorded on an internal spreadsheet so that a full logged history is developed, but all of this available in real time as well to participating network members. This powerful GPS feature has application in a number of areas, including these examples:
If you are a Monitoring Station on the Radiation Network, and want to "go mobile", then this is all you need:
After some investigation, we can now confirm that the Kauai Monitoring Station in Hawaii broadcast yet another Radiation Alert recently (see graph at right), commencing toward midnight of June 29th and continuing into the early morning hours of June 30th. This is becoming somewhat of a routine event for the Kauai station, considering elevated radiation detections twice before, on June 10th and June 22nd (see Updates below). This most recent Alert was triggered by a detection of over 100 CPM (Counts per Minute) for a sustained period of almost 15 minutes, followed by lower, yet elevated radiation levels for another half hour, making this the longest detection period yet for the Kauai station (clear sky this time - no rain). Background radiation for that station approximates 37 CPM, so these sustained levels were 2 to 3 times normal. Again, our best judgment is that the source of this radiation is probably Fukushima, perhaps from recent "releases" - we will try to correlate.
This detection by the Kauai station brings up an interesting and related story. A few days before the recent alert, the station operator was remounting the external probe of the Geiger counter under the eaves of the structure, and unwittingly scanned the roof shingles themselves, only to discover an elevated reading at a sustained rate of easily twice normal background. Moving the probe in closer proximity to the shingled roof returned more frequent audible clicking, confirming the shingles were the source. So the question is, "Why are these roof shingles emitting radiation - is it because of contamination over time by rainfall precipitating it own radioactive particles, or are the shingles themselves 'hot'?" To answer this, the station operator scanned a pile of surplus shingles in storage that had never been exposed to the rain, and found them to also set off the Geiger counter. So while we do not think of shingles as being radioactive, because they are often "composition", of stone-based products in part, any one sample can be slightly radioactive. This story serves as a lesson - when scanning captured rainwater for potential radioactive contamination, do not harvest it off any stone-based roofing material lest you get a false signal.
Update: 6/30/11, 6:15 P.M. - Web Sites down A brief note to confirm our web sites were down for half a day. This is "Chapter 2, the Final Saga" with our previous web host (see 6/9/11 Update for background), who is now history. As was the case in Chapter 1 of the story, even though this web site was down, the Radiation Network itself continued to operate, which monitoring included another tentative Radiation Alert from the Kauai station which we are investigating. Looking forward, it will take a couple of days to fix everything, including timely updating of the maps. Thank you for your patience during this period.
Update: 6/23/11, 7:50 A.M. - Kauai Station, the "Perfect Storm"
This detection follows a similar, sustained elevated radiation level from the Kauai station on June 10th - see the Update below dated 6/11/11. Other than this, since the nuclear disaster in Japan, the stations on our Network that we believe to have detected Fukushima radiation in significant and noticeable levels have been limited to a couple of high altitude stations in Colorado, and an obvious one in Japan itself. So the question is, "What is so special about the Kauai station?". In answer, I think we what have here is "the perfect storm":
So there is your "perfect storm" - in relatively close proximity, amidst a rainy environment, set up for outdoor monitoring, and using an ultra-sensitive detector. The next order of business is to place additional monitoring stations around Kauai, in both high rainfall and rain shadow areas to provide confirming readings and to test out some of the theories offered above. We also need to correlate detections with weather patterns and movements of the jet stream, combined with any verifiable "releases" of radiation from Fukushima.
Update: 6/22/11, 9:00 A.M. - False Alert Yesterday, a false alert was broadcast by one of our Monitoring Stations in South Bend, Indiana. A weird circumstance - a limb from a tree trimmer fell across the power lines killing electricity to the house, and because the radiation detector is on a A/C power supply, some sort of power surge made it through the Geiger counter. The station plans to add an electronic filter to prevent a recurrence. Sorry, folks. Update: 6/18/11, 12:00 P.M. - Fort Calhoun Nuclear Power Plant A number of concerned citizens have been following the activity at the Fort Calhoun Nuclear Power Plant in Nebraska. It is perched on the Missouri River which is in flood stage, and there is concern the plant structure could be breached, possibly impacting the cooling system of the reactor, an eerily similar circumstance as in Fukushima, and only 3 months later.
Circumstances permitting, Boys Town will try to get more specific readings. Until then, someone in the vicinity might suggest to the local TV crew that filmed the nuclear plant from a boat on the Missouri, to return with a radiation detector and report their finding on the evening news. As low as our inventory is, I could probably come up with a Geiger counter for the TV station to use, and help them interpret their readings. Thanks.
Thanks again for your support. Tim Flanegin Back to the Radiation Network Back to the Message page |
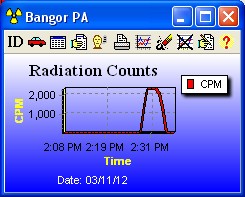 The Radiation Network experienced three different Radiation Alerts in the last
week or so. The first two were from the Bangor PA station on
March 3rd and March 11th, both midday events, and very similar to each other
in that they were extremely high readings - over 2,000 CPM, continuing
for a sustained number of minutes in each case.
The Radiation Network experienced three different Radiation Alerts in the last
week or so. The first two were from the Bangor PA station on
March 3rd and March 11th, both midday events, and very similar to each other
in that they were extremely high readings - over 2,000 CPM, continuing
for a sustained number of minutes in each case.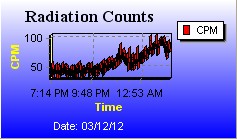 The
other Radiation Alert was from a station in Goodrich, Michigan in
the late evening of March 12th, lasting into the early morning of the
next day. The graph at left shows the classic pattern of
gradually rising radiation levels often associated with a radioactive weather
pattern moving into the environment over time. This station was running
the ultra-sensitive Inspector model, indoors in a private home,
with end window of the GM tube facing up. Nothing in her physical
surroundings changed, and moving the detector around made no significant
difference. She did report that a "storm went through starting about
2330". So if this were in fact the cause, it's amazing that whatever
type of radiation accompanied the passing storm was nevertheless detectable
indoors! My analysis - this looks like a genuine Alert to me.
The
other Radiation Alert was from a station in Goodrich, Michigan in
the late evening of March 12th, lasting into the early morning of the
next day. The graph at left shows the classic pattern of
gradually rising radiation levels often associated with a radioactive weather
pattern moving into the environment over time. This station was running
the ultra-sensitive Inspector model, indoors in a private home,
with end window of the GM tube facing up. Nothing in her physical
surroundings changed, and moving the detector around made no significant
difference. She did report that a "storm went through starting about
2330". So if this were in fact the cause, it's amazing that whatever
type of radiation accompanied the passing storm was nevertheless detectable
indoors! My analysis - this looks like a genuine Alert to me.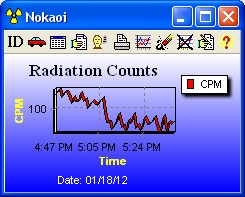 On
January 18th, at about 5:48 PM local time, the Nokaoi station in the
Taos area of New Mexico broadcast a Radiation Alert over the Network.
See the graph at right, depicting elevated readings averaging over 100 CPM
(Counts per Minute) for a sustained period of about 20 minutes, then
subsiding to near normal background levels of about 60 to 70 CPM.
On
January 18th, at about 5:48 PM local time, the Nokaoi station in the
Taos area of New Mexico broadcast a Radiation Alert over the Network.
See the graph at right, depicting elevated readings averaging over 100 CPM
(Counts per Minute) for a sustained period of about 20 minutes, then
subsiding to near normal background levels of about 60 to 70 CPM.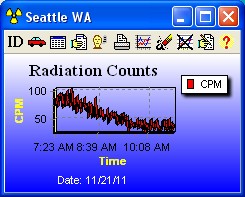 On multiple occasions
since April, we have reported to you the detection of radiation from
rainwater, by stations on this network, and here is yet another example.
The Seattle WA station, which operates a real-time, rainwater capture and radiation
scan feature (see the 10/9/11 Update), registered a level of radiation on
the morning of November 21st high enough to momentarily exceed the 100 CPM
(Counts per Minute) Alert level on our network. Rainfall had moved
into his area, and raised his detection from normal background of 36 CPM
to about 85 CPM for an extended period. The graph at right shows
the radiation level subsiding over the ensuing 2 hours.
On multiple occasions
since April, we have reported to you the detection of radiation from
rainwater, by stations on this network, and here is yet another example.
The Seattle WA station, which operates a real-time, rainwater capture and radiation
scan feature (see the 10/9/11 Update), registered a level of radiation on
the morning of November 21st high enough to momentarily exceed the 100 CPM
(Counts per Minute) Alert level on our network. Rainfall had moved
into his area, and raised his detection from normal background of 36 CPM
to about 85 CPM for an extended period. The graph at right shows
the radiation level subsiding over the ensuing 2 hours.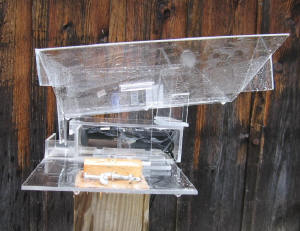 The Seattle WA
member station of the Radiation Network, the same one that gave us a
demonstration of a Mobile Monitoring Station (see Update 7/24/11), has built an outdoor Radiation Monitoring Station with a real time
Rainwater Capture accessory (photo at right). The goal is the same as what the acomfort
station conceived (see 9/10/11 Update), but Seattle's design is quite different, yet
apparently just as effective.
The Seattle WA
member station of the Radiation Network, the same one that gave us a
demonstration of a Mobile Monitoring Station (see Update 7/24/11), has built an outdoor Radiation Monitoring Station with a real time
Rainwater Capture accessory (photo at right). The goal is the same as what the acomfort
station conceived (see 9/10/11 Update), but Seattle's design is quite different, yet
apparently just as effective.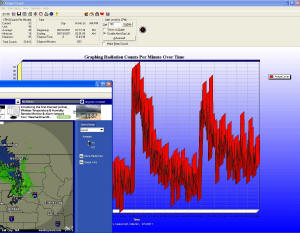
 so the rest of us can benefit from his scanning data.
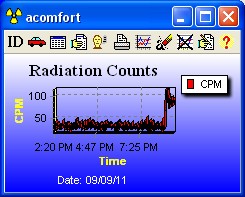 Yesterday
evening, September 9th, one of our Bay area Monitoring Stations,
specifically in Menlo Park, CA, broadcast a Radiation Alert at
about 9:00 P.M., averaging around 100 CPM for a period of 13 minutes
(see graph at right). We are pretty sure what triggered the alert -
radioactive rainwater, and this particular station detected that in real
time! This is the one of the first station's on our network to have
prototyped a system to do just that.
Yesterday
evening, September 9th, one of our Bay area Monitoring Stations,
specifically in Menlo Park, CA, broadcast a Radiation Alert at
about 9:00 P.M., averaging around 100 CPM for a period of 13 minutes
(see graph at right). We are pretty sure what triggered the alert -
radioactive rainwater, and this particular station detected that in real
time! This is the one of the first station's on our network to have
prototyped a system to do just that.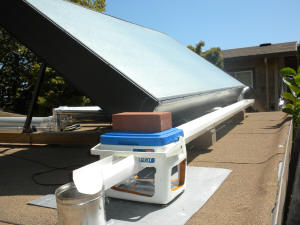 As
to the the rainwater capture accessory - he collects free-falling rainwater off of
his solar panel (see photo at left), instead of his roof (which earlier tests showed to be
slightly radioactive), and then uses the gutter plumbing to pass that
rainwater directly under and by the radiation detector, adding a "dam"
in the gutter to slow the rainflow sufficiently for a valid reading. For
extra measure, the system ends with a paint can to collect the rainwater for
later analysis.
As
to the the rainwater capture accessory - he collects free-falling rainwater off of
his solar panel (see photo at left), instead of his roof (which earlier tests showed to be
slightly radioactive), and then uses the gutter plumbing to pass that
rainwater directly under and by the radiation detector, adding a "dam"
in the gutter to slow the rainflow sufficiently for a valid reading. For
extra measure, the system ends with a paint can to collect the rainwater for
later analysis.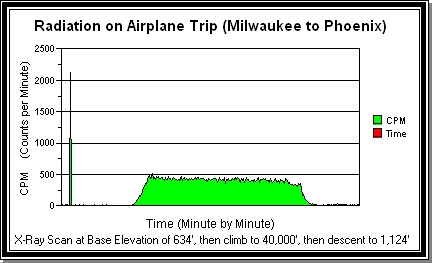 one of the few to have a
data logging feature that enables radiation count history to be stored
remotely in the instrument, and then later uploaded to a computer for analysis. The graph at
right illustrates the journey.
one of the few to have a
data logging feature that enables radiation count history to be stored
remotely in the instrument, and then later uploaded to a computer for analysis. The graph at
right illustrates the journey.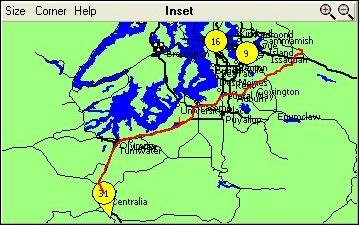 Update: 7/24/11, 11:15 A.M. - Mobile Monitoring Station
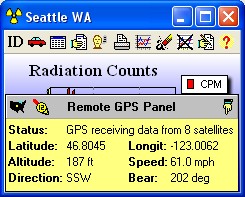 Participating
members on the network were also able to follow Seattle WA's progress through a
pop-up GPS menu shown at left, indicating satellite reception,
map coordinates, altitude, speed, and bearing and direction
of travel.
Participating
members on the network were also able to follow Seattle WA's progress through a
pop-up GPS menu shown at left, indicating satellite reception,
map coordinates, altitude, speed, and bearing and direction
of travel.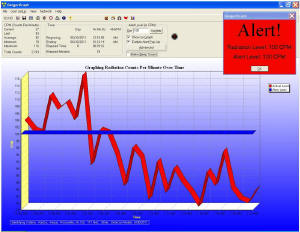 Update:
7/6/2011, 7:50 A.M. - Kauai Radiation Alert - again
Update:
7/6/2011, 7:50 A.M. - Kauai Radiation Alert - again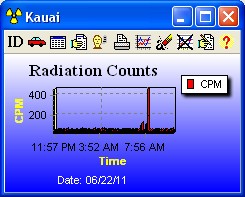 Yesterday, June 22nd, our
network's Monitoring Station on the island of Kauai, within the
Hawaiian island chain, broadcast yet another Radiation Alert over the Network,
at 8:08 A.M. local time - a 3 minute surge of 209, 456, and 186 CPM (Counts per
Minute) respectively, accompanied by a generally elevated level leading up to that, and
followed by another blip at 2:52 P.M. The Kauai station indicates it was
raining at the time, so we believe the precipitation brought down
Fukushima fallout from the atmosphere.
Yesterday, June 22nd, our
network's Monitoring Station on the island of Kauai, within the
Hawaiian island chain, broadcast yet another Radiation Alert over the Network,
at 8:08 A.M. local time - a 3 minute surge of 209, 456, and 186 CPM (Counts per
Minute) respectively, accompanied by a generally elevated level leading up to that, and
followed by another blip at 2:52 P.M. The Kauai station indicates it was
raining at the time, so we believe the precipitation brought down
Fukushima fallout from the atmosphere.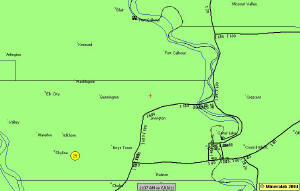 Our
network has one Monitoring Station nearby, in Boys Town, 20
miles away to the south southwest. On the map at left, Fort Calhoun is
the nuclear site at top center, on the blue-lined river, while the Monitoring
Station is the yellow circle at bottom left. For context, Omaha is the
urban center at bottom right. The Boys Town station is monitoring
indoors for the time being, and her readings of environmental radiation
levels are averaging 37 CPM (Counts per Minute) which is quite normal
for the high count rate, pancake-tubed Inspector model that she is using.
Our
network has one Monitoring Station nearby, in Boys Town, 20
miles away to the south southwest. On the map at left, Fort Calhoun is
the nuclear site at top center, on the blue-lined river, while the Monitoring
Station is the yellow circle at bottom left. For context, Omaha is the
urban center at bottom right. The Boys Town station is monitoring
indoors for the time being, and her readings of environmental radiation
levels are averaging 37 CPM (Counts per Minute) which is quite normal
for the high count rate, pancake-tubed Inspector model that she is using.